SEO Report Dashboard
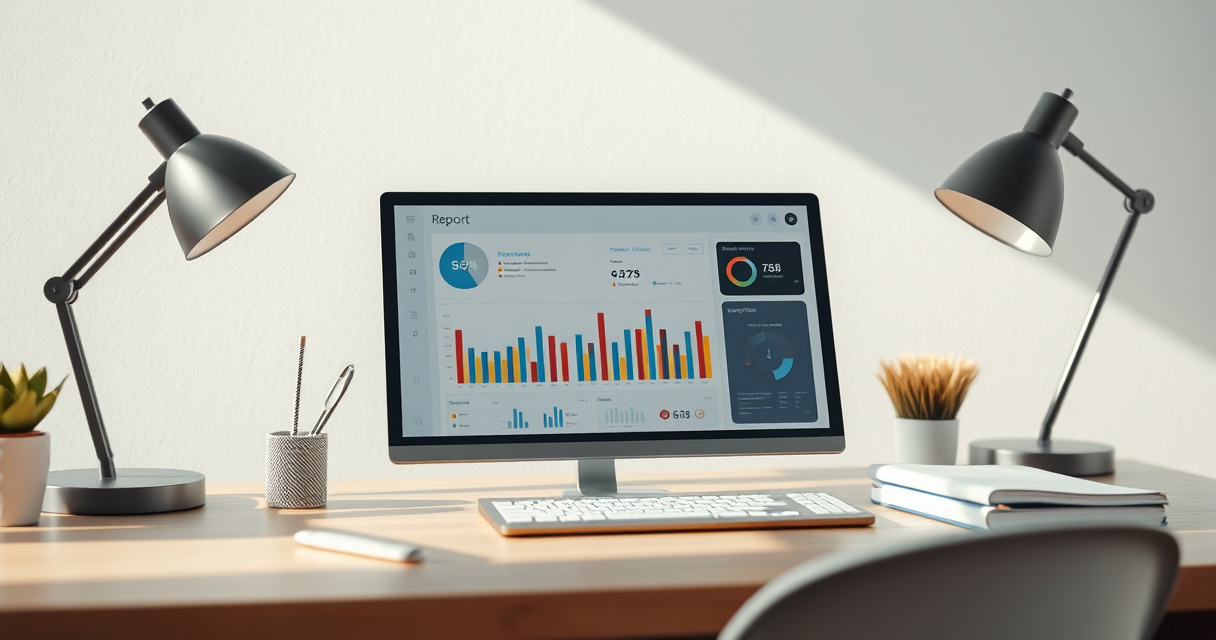
An SEO report dashboard is a visual reporting tool that consolidates organic search metrics from sources like Google Search Console and Google Analytics into one view.
Key takeaways
- An SEO report dashboard centralizes organic search metrics from multiple sources into one view.
- Common metrics include organic traffic, keyword rankings, impressions, clicks, CTR, backlinks, and technical health signals.
- Avoid showing raw metrics without tying them to business outcomes like conversions or revenue.
- Role-based dashboards help different teams (executives, SEO specialists, content teams) see what matters to them.
- Free tools like Looker Studio let you build a custom dashboard without spending money.
It helps SEO practitioners quickly see whether organic search performance is improving, what changed, and which actions to prioritize next.
What is an SEO report dashboard used for?
- Track organic traffic trends over time (daily, weekly, monthly).
- Monitor keyword rankings and changes in position.
- Analyze click-through rates (CTR) for queries and pages.
- Measure conversions and revenue from organic search.
- Spot technical issues like indexing errors, Core Web Vitals problems, or crawl anomalies.
- Communicate results to clients or stakeholders without manual spreadsheet work.
- Create role-based views for executives, SEO specialists, content teams, and technical teams.
Quick start: Build your first SEO dashboard
- Connect your data sources – Link Google Search Console, Google Analytics, and any third-party tools (e.g., Semrush, Ahrefs).
- Define your KPIs – Choose 5–10 metrics that answer your main business question (e.g., organic traffic, goal completions, top landing pages).
- Choose a dashboard tool – Use Looker Studio (free) or a paid tool like Semrush or Ahrefs.
- Build your layout – Create sections: executive overview, keyword performance, page performance, technical health.
- Set up automatic updates – Schedule daily or weekly refreshes so data stays current.
- Share with stakeholders – Grant view-only access or export as PDF.
When NOT to start with an SEO report dashboard
- You have no SEO data yet – Build a foundation first (install tracking, submit sitemap).
- You only need a one-time report – A static PDF or slide deck is faster.
- Your team lacks time to maintain it – Dashboards require periodic updates and data quality checks.
- You are not ready to act on insights – A dashboard without follow-up actions is just decoration.
Alternatives to an SEO report dashboard
| Tool | Best for | Price |
|---|---|---|
| Google Search Console | Basic query and page performance data | Free |
| Google Analytics | Traffic, behavior, and conversion analysis | Free |
| Looker Studio | Custom, free dashboards from multiple sources | Free |
| Semrush | All-in-one SEO suite with built-in reporting | Paid |
| Ahrefs | Backlink and keyword tracking with dashboards | Paid |
Next step
FAQ
What is the difference between an SEO report and an SEO dashboard?
An SEO report is a static document (PDF, slide deck) delivered periodically. An SEO dashboard is a live, interactive view that updates automatically.
Which metrics should I include in my SEO dashboard?
Focus on organic traffic, keyword rankings, impressions, clicks, CTR, backlinks, conversions, and technical health signals like Core Web Vitals and indexing status.
Can I build a free SEO dashboard?
Yes. Looker Studio (formerly Google Data Studio) is free and connects to Google Search Console, Google Analytics, and many other data sources.
Related topics
Sources
- Google Search Central — Best source for indexing, crawling, search appearance, and measurement-related guidance from Google.
- Google Analytics Help — Authoritative source for GA4 events, conversions, channel grouping, and reporting definitions.
- Google Search Console Help — Authoritative source for query, page, click, impression, and indexing data definitions.
- Looker Studio Help — Useful for dashboard construction, data connectors, charts, and report sharing.
- Ahrefs Blog — Well-known SEO reference for practical dashboard structure and KPI selection.
Reviewed by Lucía Marín, Founding editor.